Sisense Delight — Explainer Video
Client: Sisense Industry: SaaS / Business Intelligence & Analytics Video type: Explainer Video Length: ~60 seconds Series: Part 3 of 3 (Connect → Build → Delight)
This is the final video in a three-part explainer series for Sisense. While Connect focused on data ingestion and Build covered dashboard creation, Delight shows the end-user experience—how product managers, developers, and end users interact with analytics daily.
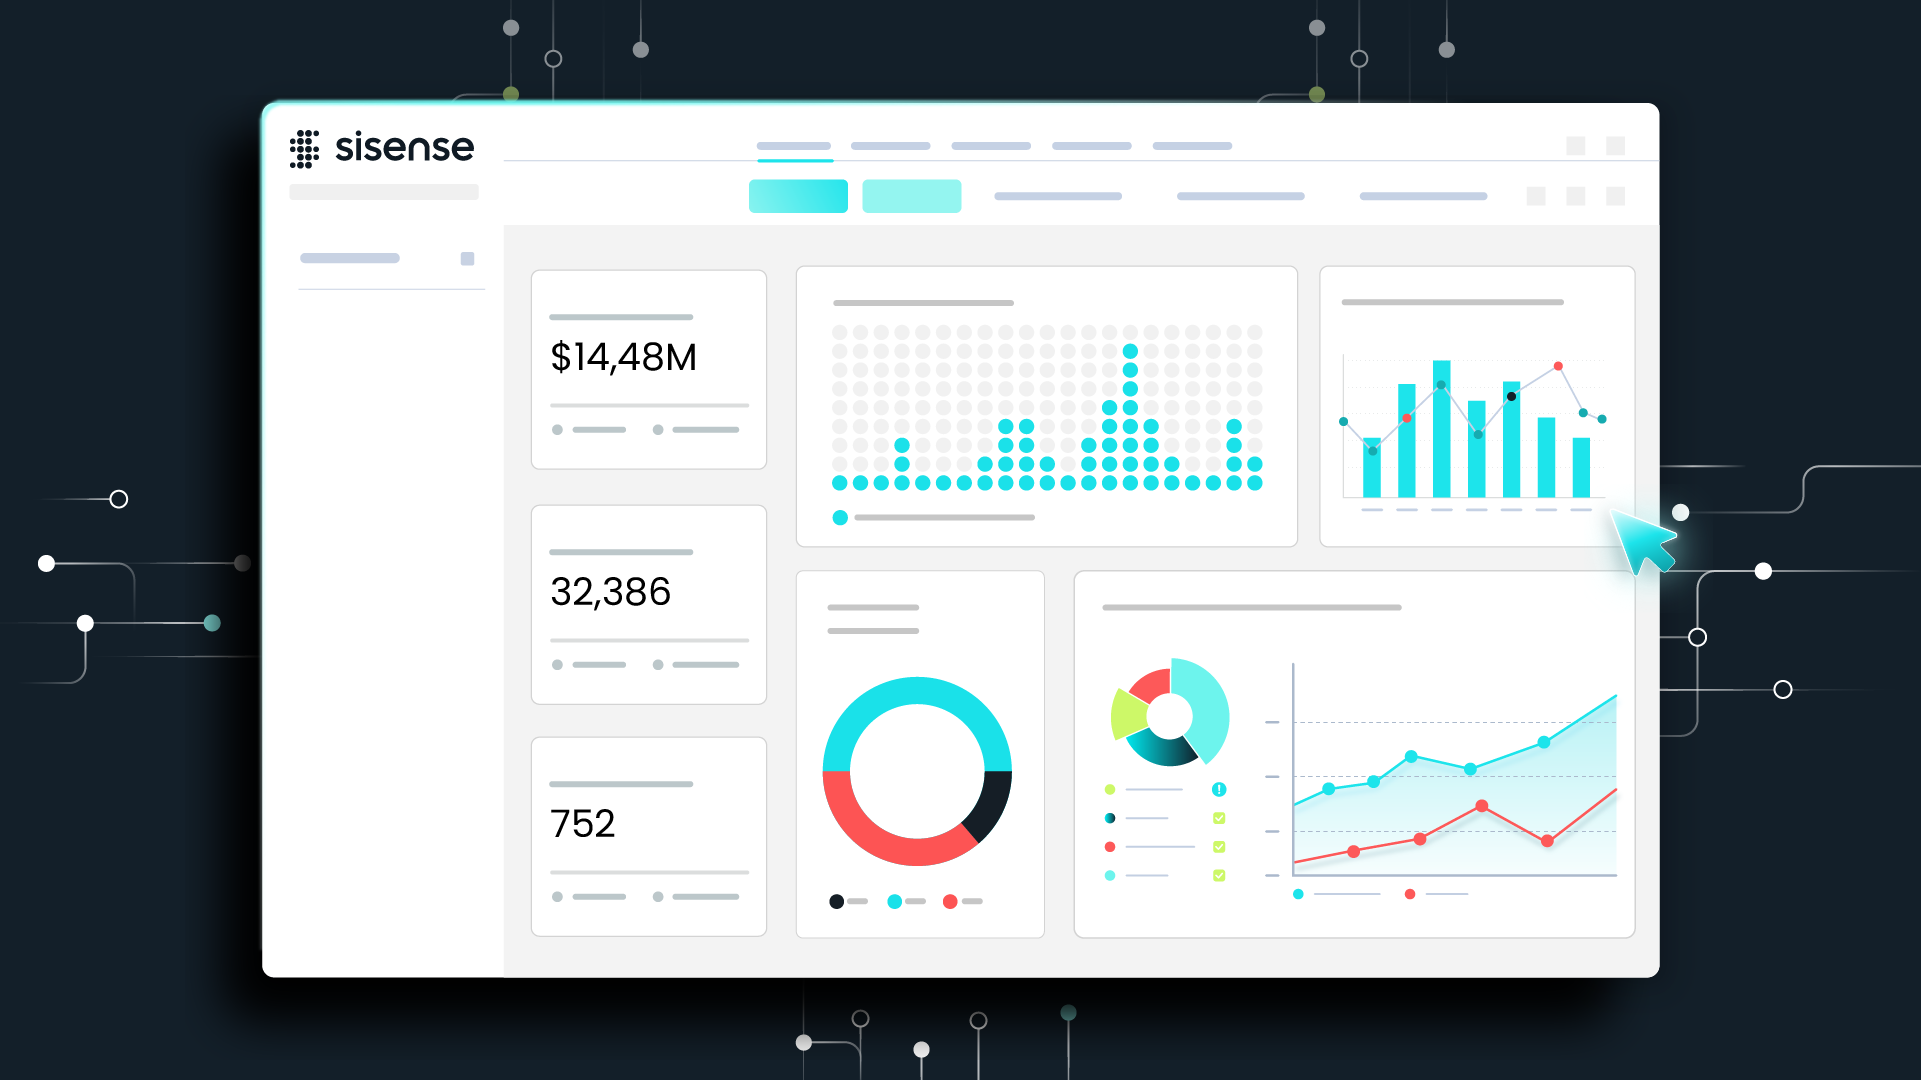
The video demonstrates three layers of the Sisense experience: product managers using point-and-click, on-demand analytics to determine their best visualizations; developers bringing ideas to life with code-level customization that transforms greyscale dashboards into fully branded, interactive interfaces; and end users accessing intuitive, contextual insights without opening additional tools.
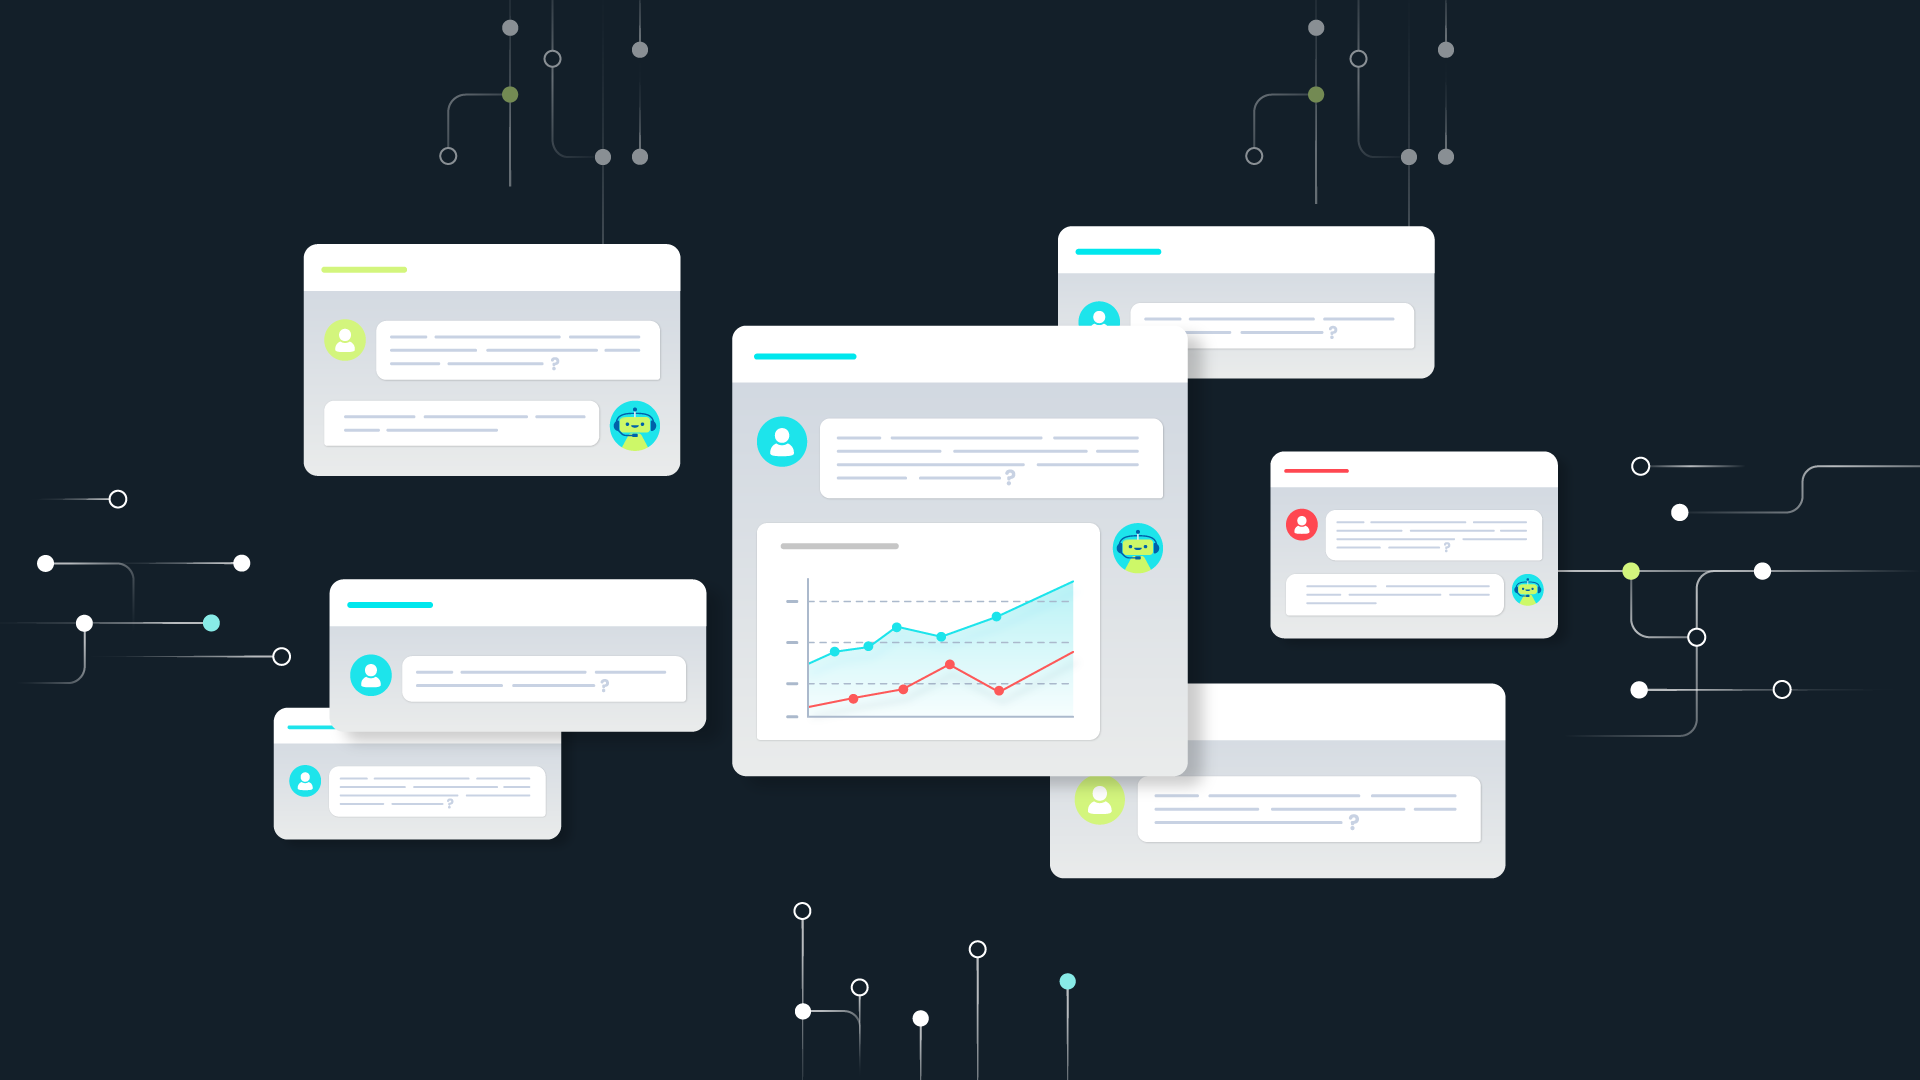
Key capabilities featured: drag-and-drop dashboard building, natural language query (NLQ) for asking advanced questions in plain language, AI-generated summaries and recommendations, anomaly and trend detection, and a composable, modular platform that upgrades existing apps with embedded intelligence.
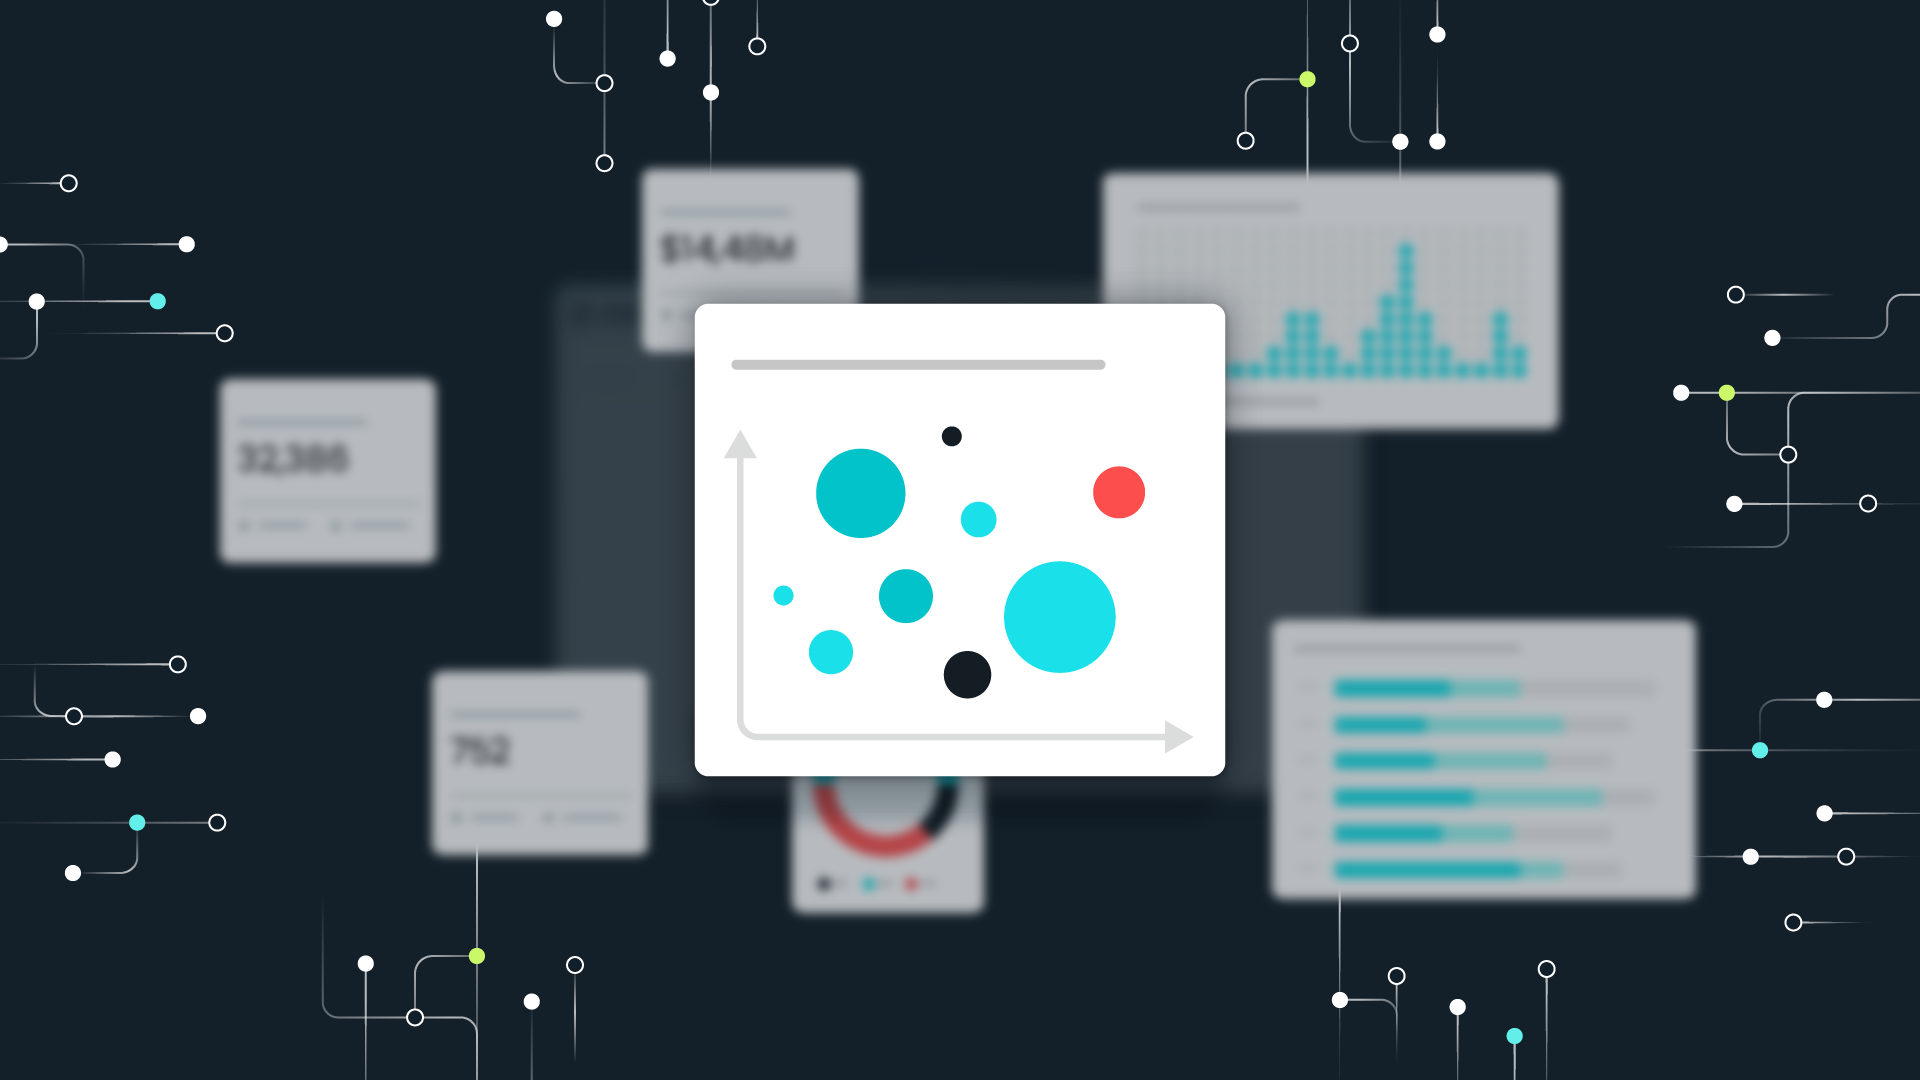
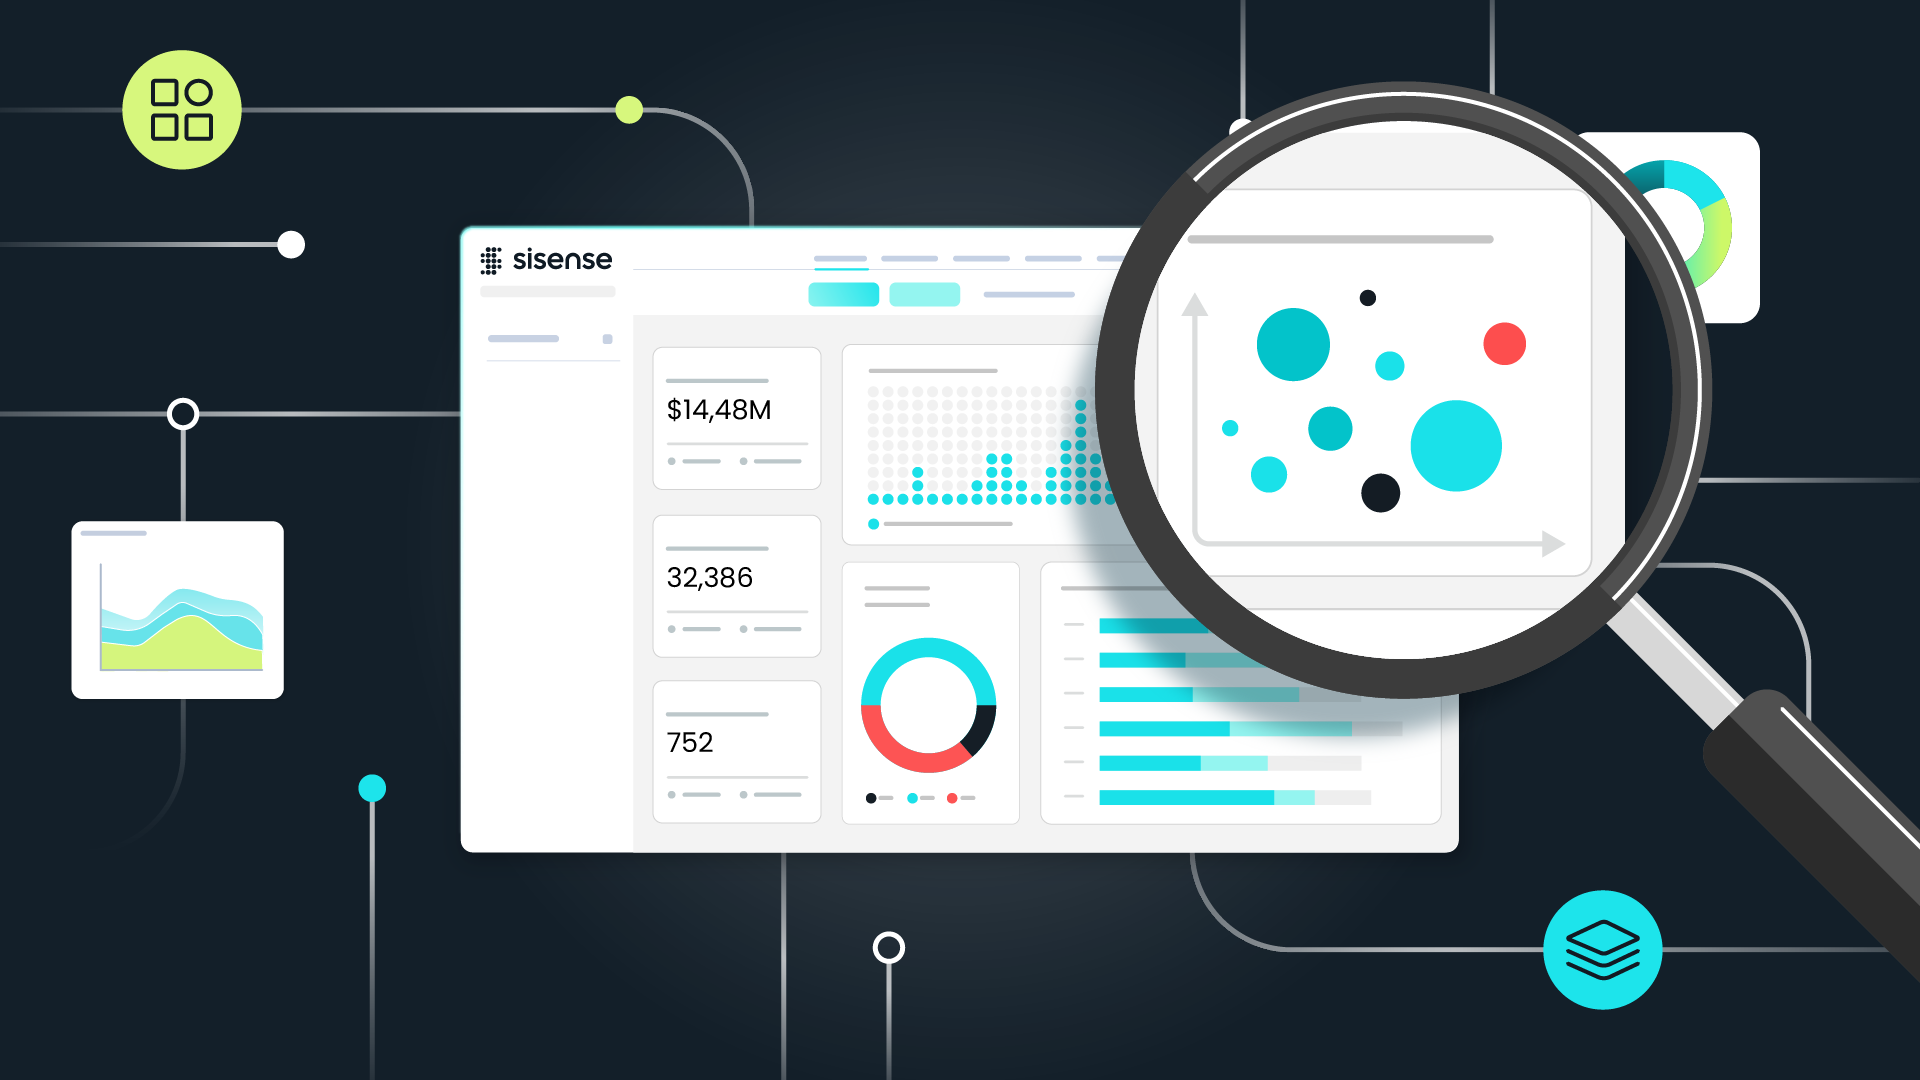
Visual approach: stylized cursor interactions, code-to-dashboard color transformation sequences, magnifying glass data exploration, chat-bubble NLQ interface, and AI recommendation overlays — all in Sisense brand colors with signature overlap design elements.
Deliverables: script collaboration, storyboard, 2D animation, sound design, and platform-ready formats.